Select Item below to DOWNLOAD - Once item is selected, right click and choose 'save as'
cf1148bf-4da4-446b-aed6-46f174842f52
Figure 14
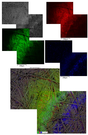
Figure 14. False color maps from tideline region on the UICB unsized paper, after 21
days of aging. The bottom right image combines the assigned colors showing how
different elements deposit as particles and in bands and co-locate, e.g. Mg and S.
Figure 14. False color maps from tideline region on the UICB unsized paper, after 21
days of aging. The bottom right image combines the assigned colors showing how
different elements deposit as particles and in bands and co-locate, e.g. Mg and S.
Permission must be secured from the individual copyright owners to reproduce any copyrighted materials contained within this website. Digital assets without any copyright restrictions are public domain.
Public domain:Full Granting Rights
Image
NPS-wide, Code: NPS
01/01/0001
Public Can View
Tuesday, February 15, 2022 11:38:21 AM
Tuesday, February 15, 2022 11:49:37 AM
Fig14.jpg
Monday, January 1, 0001 12:00:00 AM
jpg
127.0 kB
Scenic