Select Item below to DOWNLOAD - Once item is selected, right click and choose 'save as'
56d376eb-af40-4056-a2a8-55d5eca412af
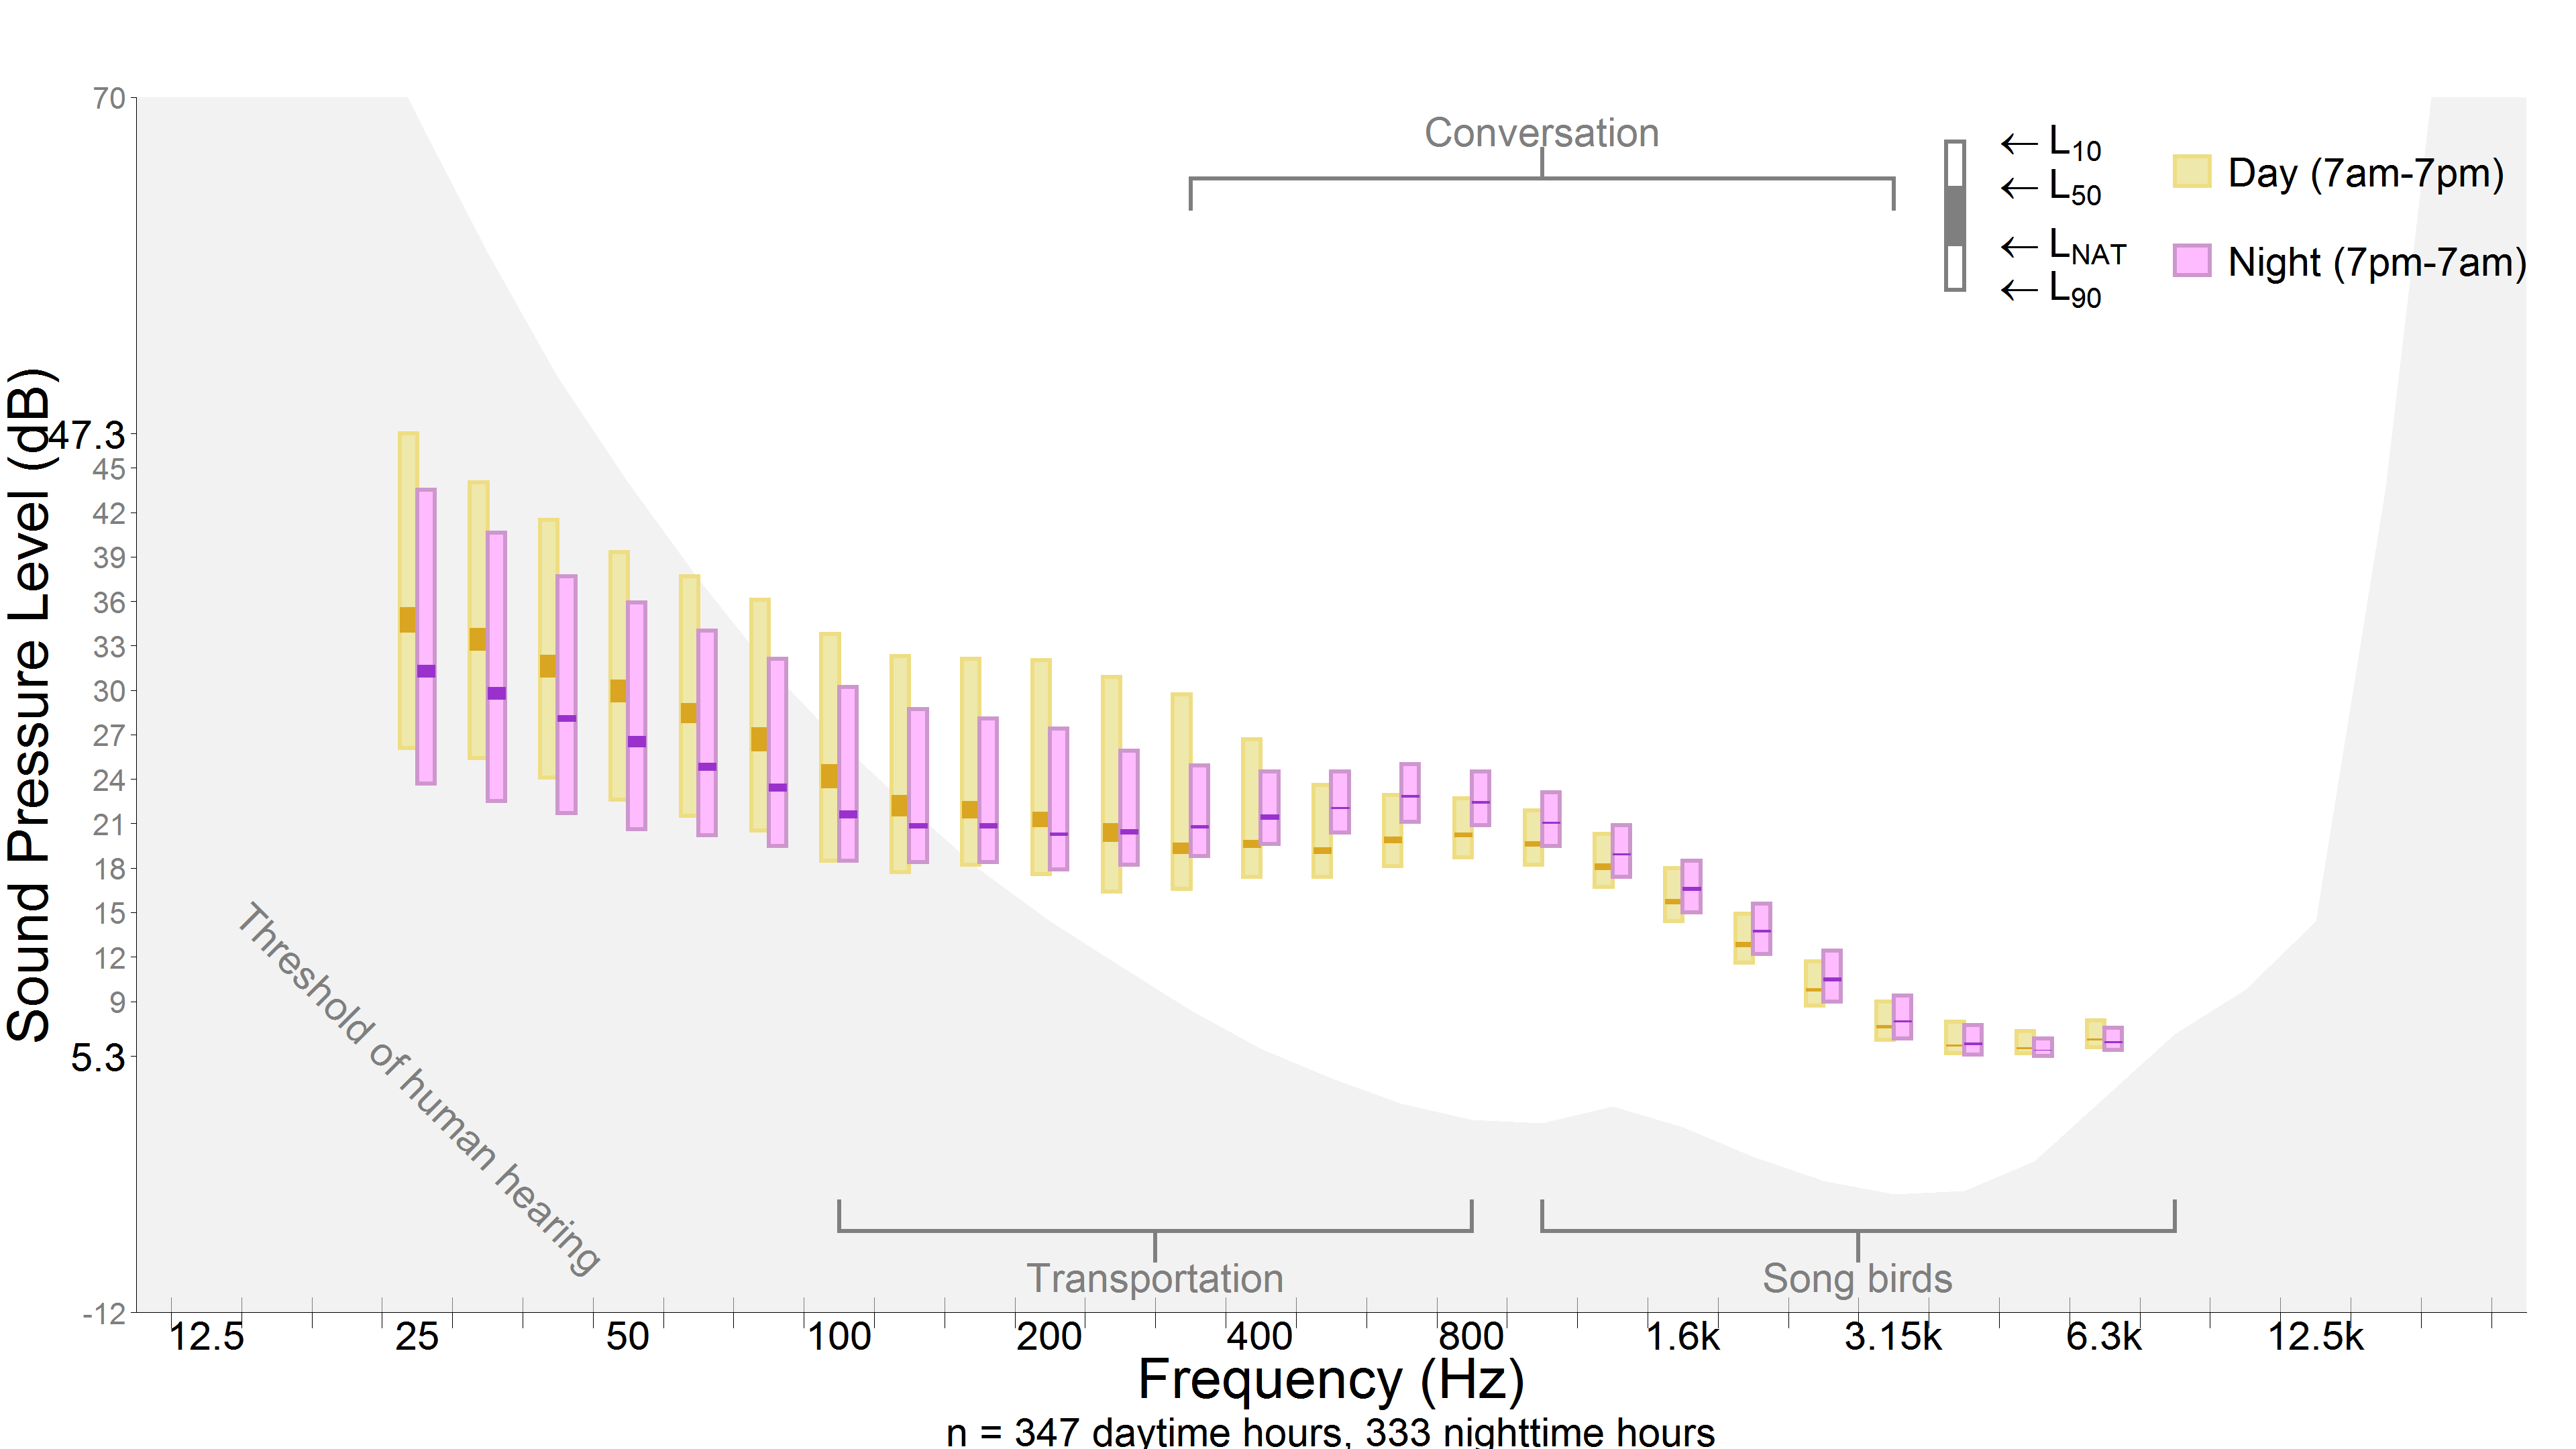
Mount Rainier Soundscape: Ptarmigan 2013 SPL vs FREQ Graph
Graph of Sound Pressure Level (dB) on y axis and Frequency (Hz) on x axis for day (yellow bars) and night (pink bars) time periods.
Graph of Sound Pressure Level (SPL) versus Frequency (FREQ) for the Ptarmigan soundscape in 2013.
Permission must be secured from the individual copyright owners to reproduce any copyrighted materials contained within this website. Digital assets without any copyright restrictions are public domain.
Public domain
Image
Mount Rainier National Park, Code: MORA
Mount Rainier National Park, Washington
Latitude: 46.865608215332, Longitude: -121.682601928711
Latitude: 46.865608215332, Longitude: -121.682601928711
https://www.nps.gov/mora/learn/nature/soundscapes.htm
02/16/2018
Public Can View
Person: Kristyn Loving
Organization: MORA
Position: Web & New Media Manager
Email: kristyn_loving@nps.gov
Organization: MORA
Position: Web & New Media Manager
Email: kristyn_loving@nps.gov
Friday, February 16, 2018 2:47:13 PM
Friday, February 16, 2018 2:47:13 PM
Ptarmigan2013_MORA011_Summer_SPLvFREQ.png
png
87.1 kB