Select Item below to DOWNLOAD - Once item is selected, right click and choose 'save as'
f11fd5e9-3724-4a09-a5df-dfa86bdffcd4
Chart 4_1970s Race_edited.jpg
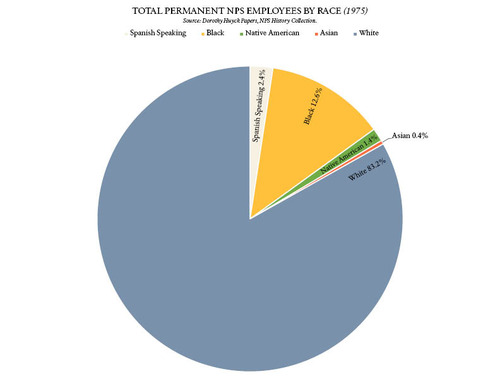
Pie Chart. Data represents the racial background for permanent NPS employees in 1975 only. Whites represent 83.2 percent while Blacks are 12 percent. Native American are 1.4 percent of the workforce and Asians only 0.4 percent. The data for Hispanic individuals was recorded as “Spanish Speaking” and may not be accurate but the small number (2.4 percent) is certainly telling.
Pie chart representing total permanent NPS employees by race in 1975.
Permission must be secured from the individual copyright owners to reproduce any copyrighted materials contained within this website. Digital assets without any copyright restrictions are public domain.
NPS History Collection/McKenzie Hitchcock
Public domain:Full Granting Rights
Image
Harpers Ferry Center, Code: HFC
04/01/2021
01/01/0001
Public Can View
Friday, April 2, 2021 10:22:29 AM
Friday, April 2, 2021 10:22:29 AM
Chart 4_1970s Race_edited.jpg
Monday, January 1, 0001 12:00:00 AM
jpg
36.0 kB
Scenic