Select Item below to DOWNLOAD - Once item is selected, right click and choose 'save as'
bb1a47dc-4ca4-46cd-a589-8db4dfa7141c
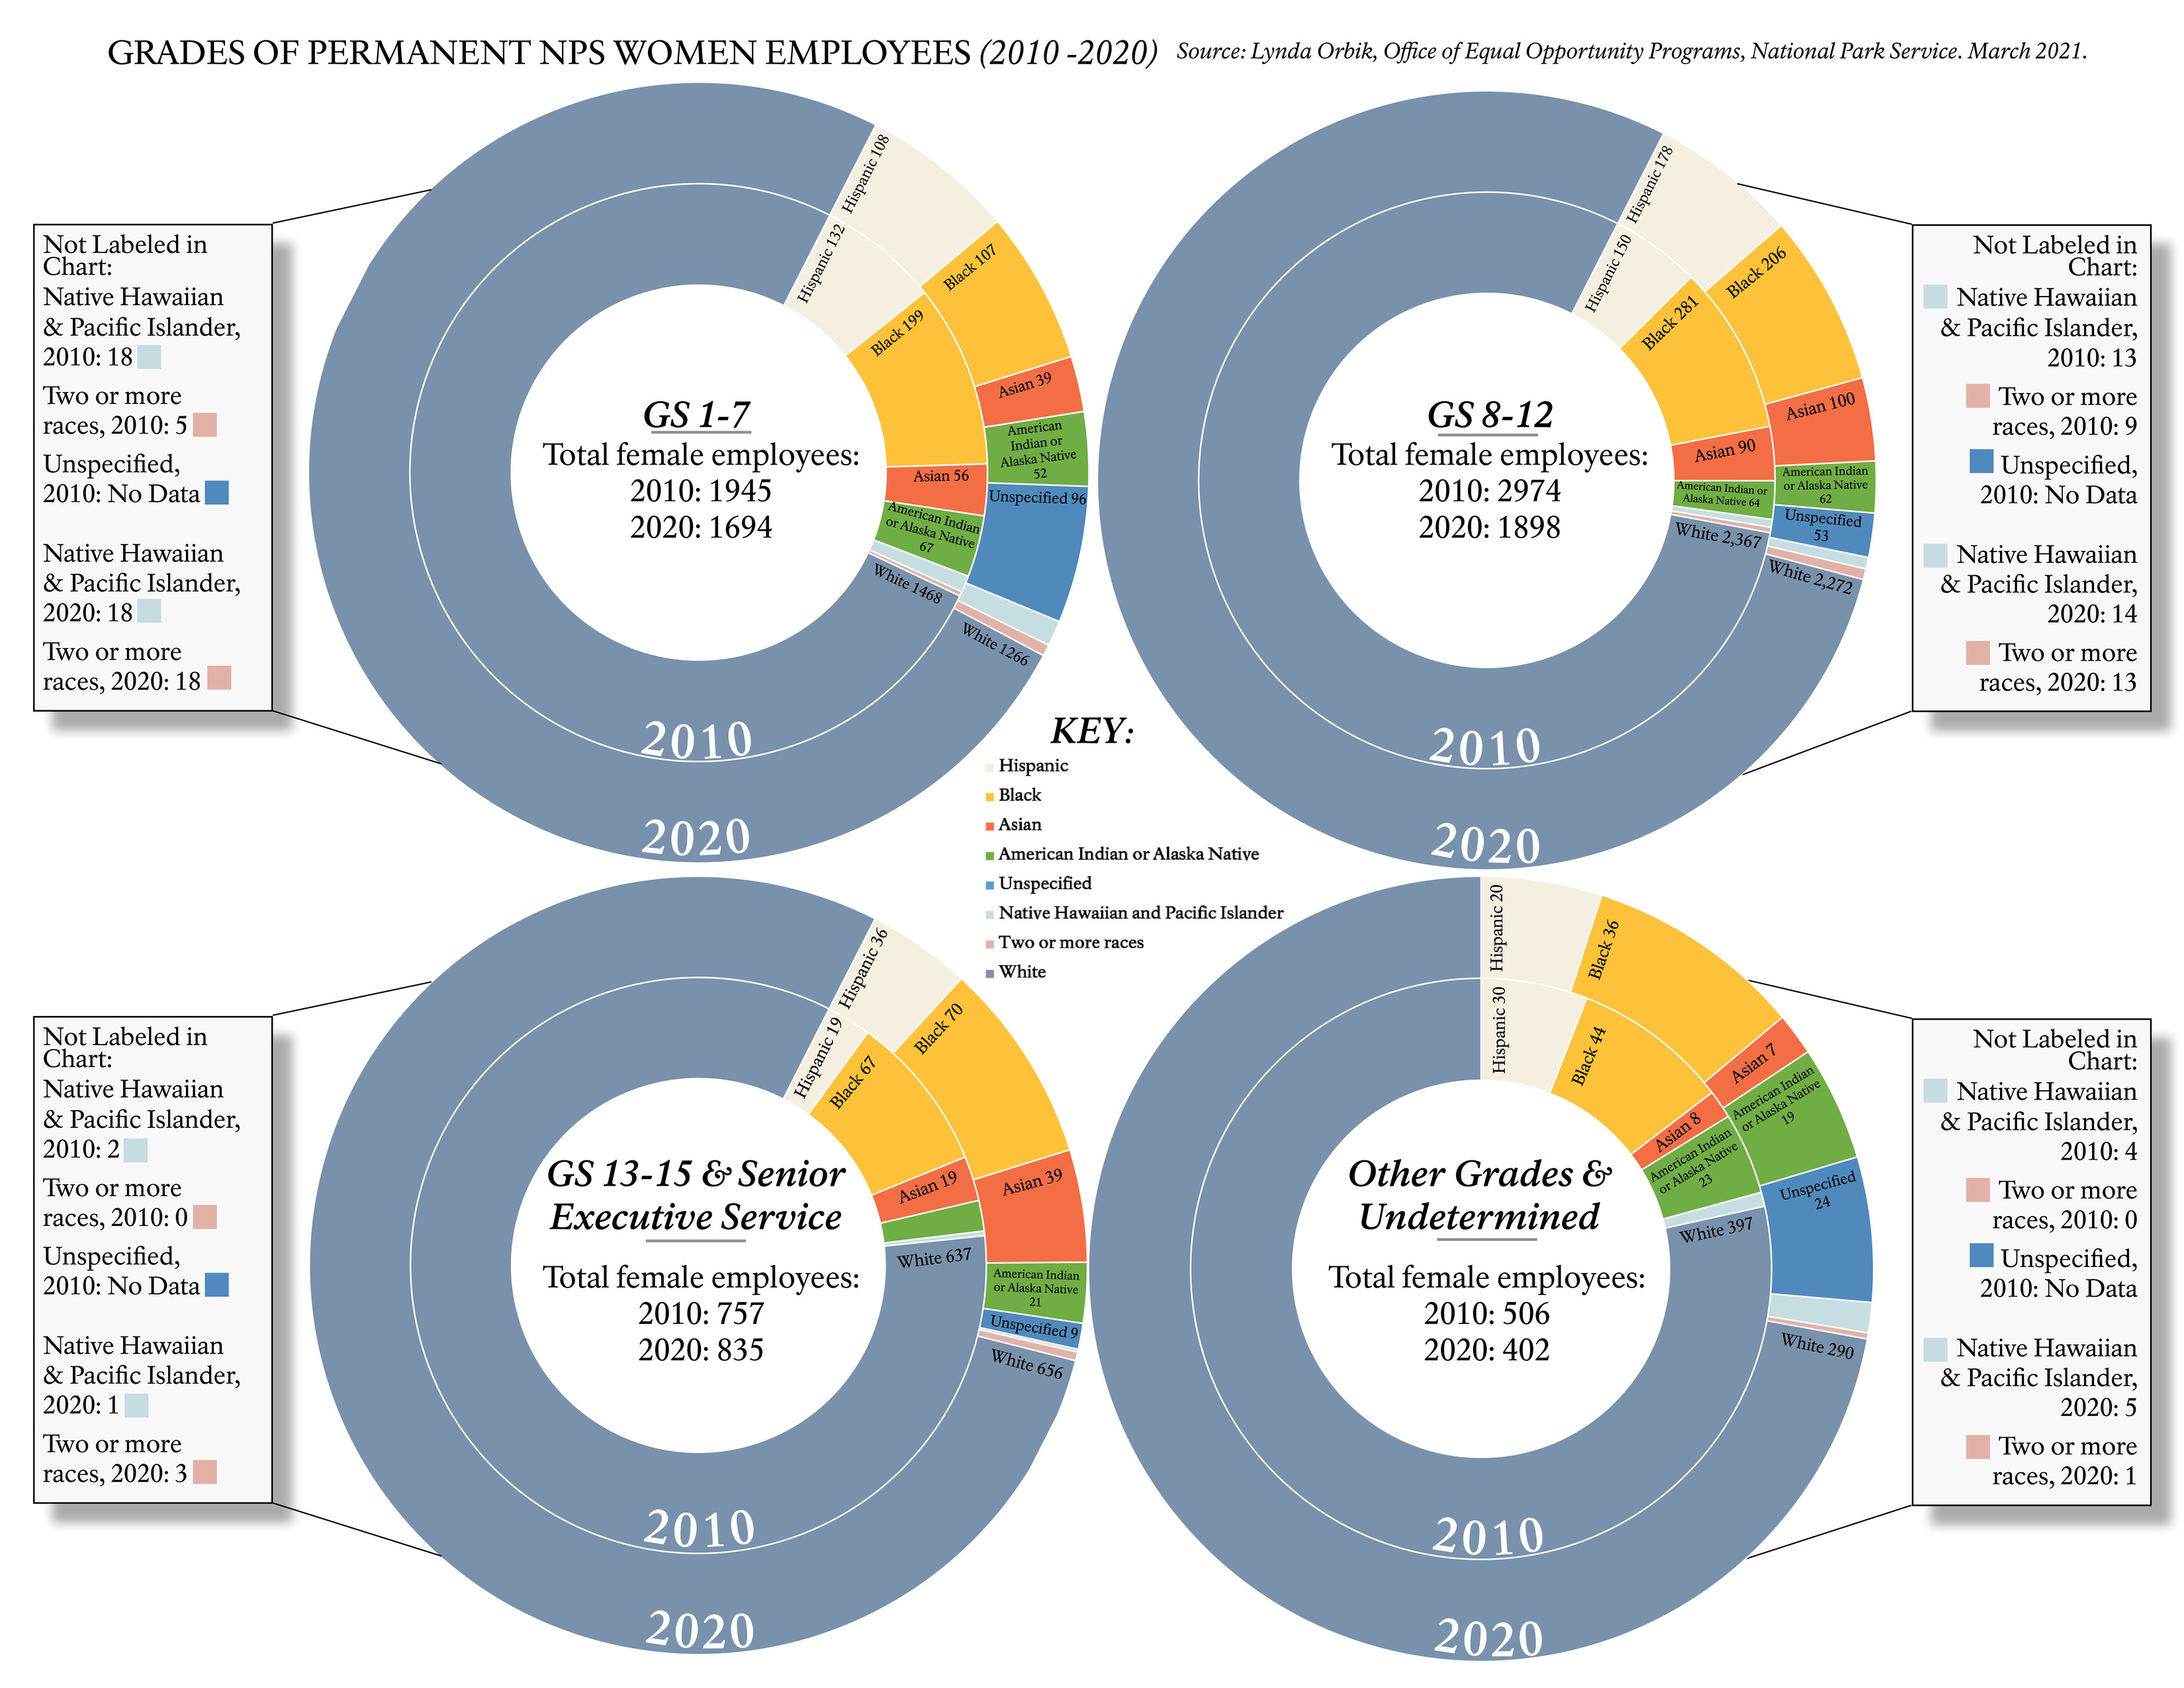
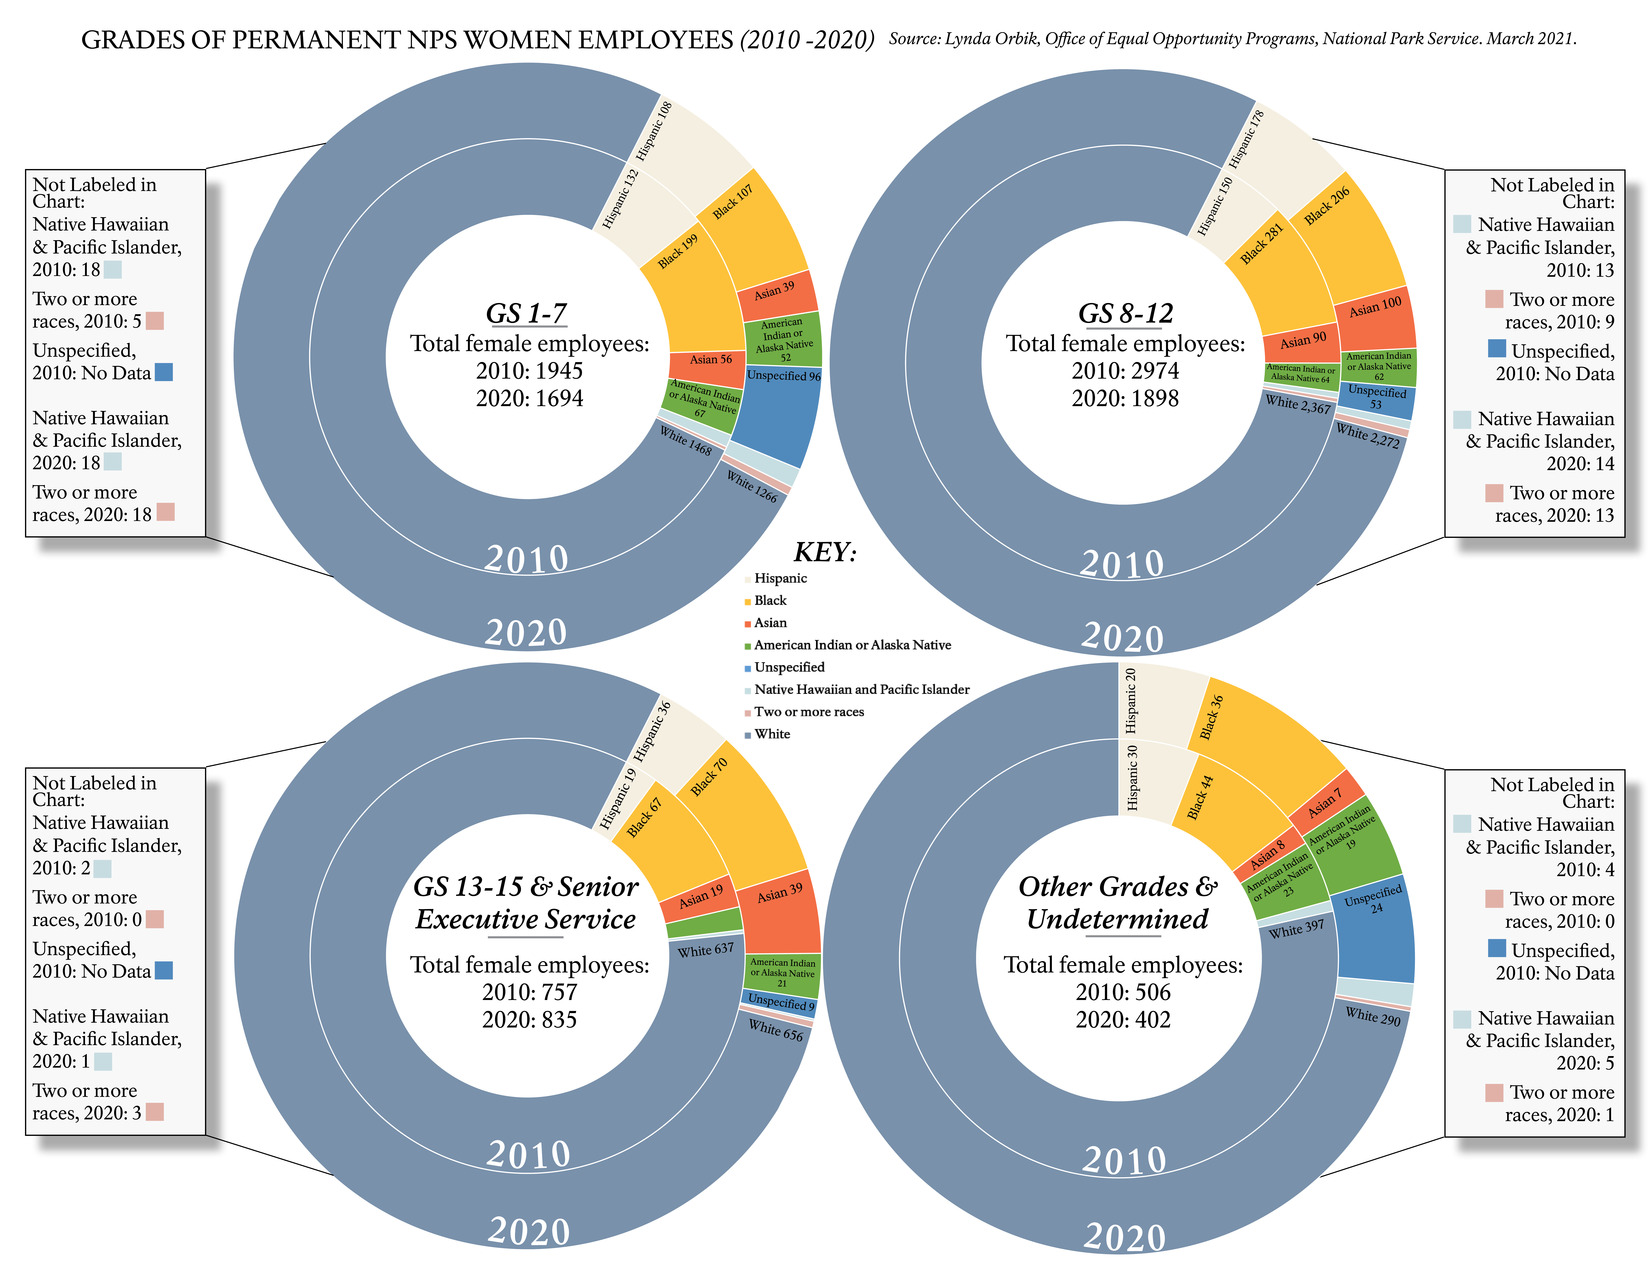
Grades of Permanent NPS Women Employees By Race (2010-2020)
Four graphs of women in permanent NPS positions by grade level and race (2010-2020).
Four Pie Charts. Each chart contains data by job grade level (representing salary ranges) from 2010 and 2020. Data in each chart is in two concentric rings and compares the women in the NPS workforce by race. In the chart for grades GS 1-7 (the lowest salaries), the total number of women was 1,945 in 2010 and 1,694 in 2020. With fewer women hired overall, representations declined somewhat. However, White women still hold the majority of jobs. Black women have the greatest decline from 2010 (199) to 2020 (107). In the chart for grades 8-12, the total number of women was 2,974 in 2010 and 1,898 in 2020, demonstrating a marked decrease in women in these higher paying jobs for all women. White women also hold most jobs at these levels. Although Hispanic and Asian women see a small increase, Black women lose positions from 2010 (281) to 2020 (206). In the chart for grades 13-15 and senior executive service, the total number of women was 757 in 2010 and 835 in 2020, a slight increase in women executives.
Permission must be secured from the individual copyright owners to reproduce any copyrighted materials contained within this website. Digital assets without any copyright restrictions are public domain.
NPS History Collection/McKenzie Hitchcock
Public domain:Full Granting Rights
Image
Harpers Ferry Center, Code: HFC
04/01/2021
01/01/0001
Public Can View
Sunday, May 2, 2021 8:33:23 PM
Sunday, May 2, 2021 8:33:23 PM
NPS Grades by Race Edited.jpg
Monday, January 1, 0001 12:00:00 AM
jpg
17.3 MB
Scenic