Select Item below to DOWNLOAD - Once item is selected, right click and choose 'save as'
b3ff3666-5c59-43fd-bfb5-df033cd5e6e3
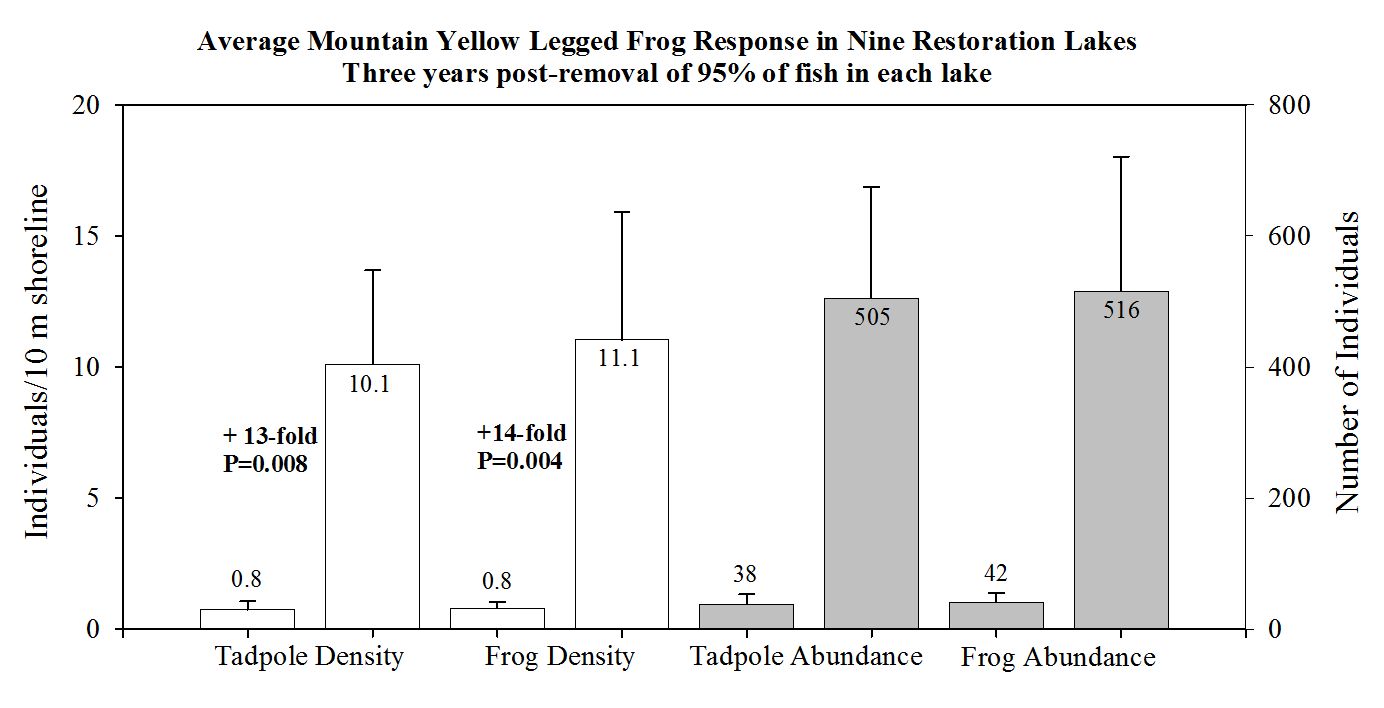
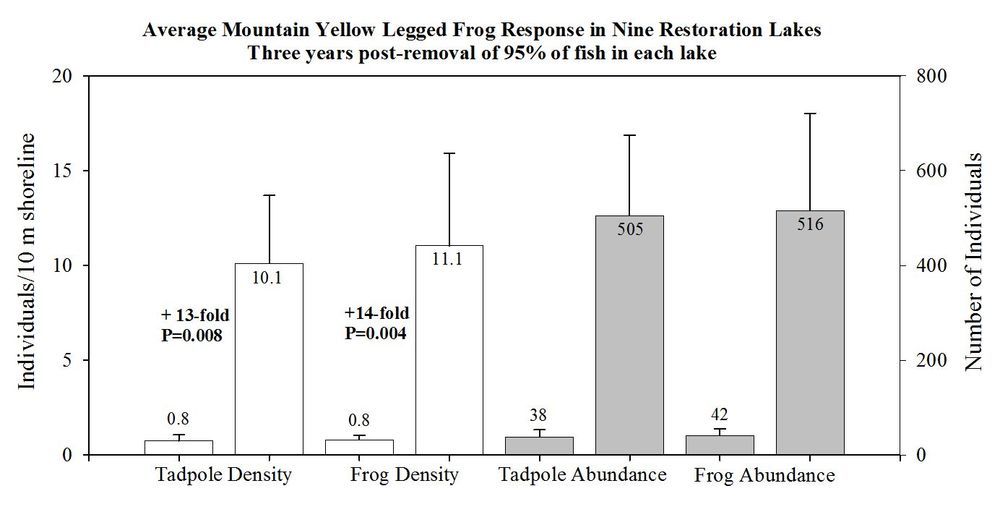
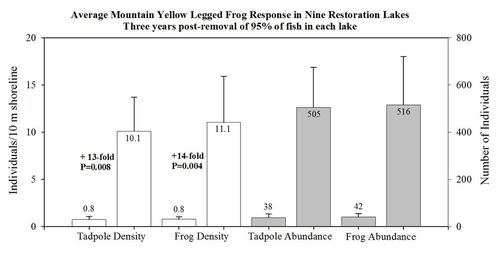
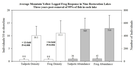
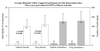
Chart of change in average density and abundance of mountain yellow-legged tadpoles and frogs in 9 restoration lakes in SEKI that remained disease-free 3 years after removal of 95 percent of non-native trout in each lake.
Chart of change in average density (number counted per 10 meters of shoreline per survey) and average abundance (number counted per survey) of mountain yellow-legged tadpoles and frogs in 9 restoration lakes in SEKI that remained disease-free 3 years after removal of 95 percent of non-native trout in each lake. Baseline averages (left bar of each pair) were calculated from frog surveys conducted in the initial year of restoration in each lake, and response averages (right bar of each pair) were calculated from frog surveys conducted 3 years past the year in which 95 percent of fish were removed from each lake. One to three surveys were conducted per lake during each season.
Permission must be secured from the individual copyright owners to reproduce any copyrighted materials contained within this website. Digital assets without any copyright restrictions are public domain.
Public domain
Toads and frogs (Anura), ()
, Endangered and threatened animals, ()
, Exotic or invasive animals, ()
, Lakes, ()
, Ecosystem management, ()
, Endangered and threatened animals, ()
, Exotic or invasive animals, ()
, Lakes, ()
, Ecosystem management, ()
Image
Sequoia and Kings Canyon National Parks, Code: SEKI
Sequoia and Kings Canyon National Parks, California
Latitude: 36.7172584533691, Longitude: -118.537902832031
Latitude: 36.7172584533691, Longitude: -118.537902832031
03/15/2013
Public Can View
Monday, February 22, 2010 4:48:23 PM
Thursday, August 10, 2017 6:27:13 AM
SEKI-743011325a884068a916696de80039fe.tif
Monday, January 1, 0001 12:00:00 AM
tif
53.9 kB
Budget