Select Item below to DOWNLOAD - Once item is selected, right click and choose 'save as'
929d7f91-07a6-48b6-97d5-ef48eef93511
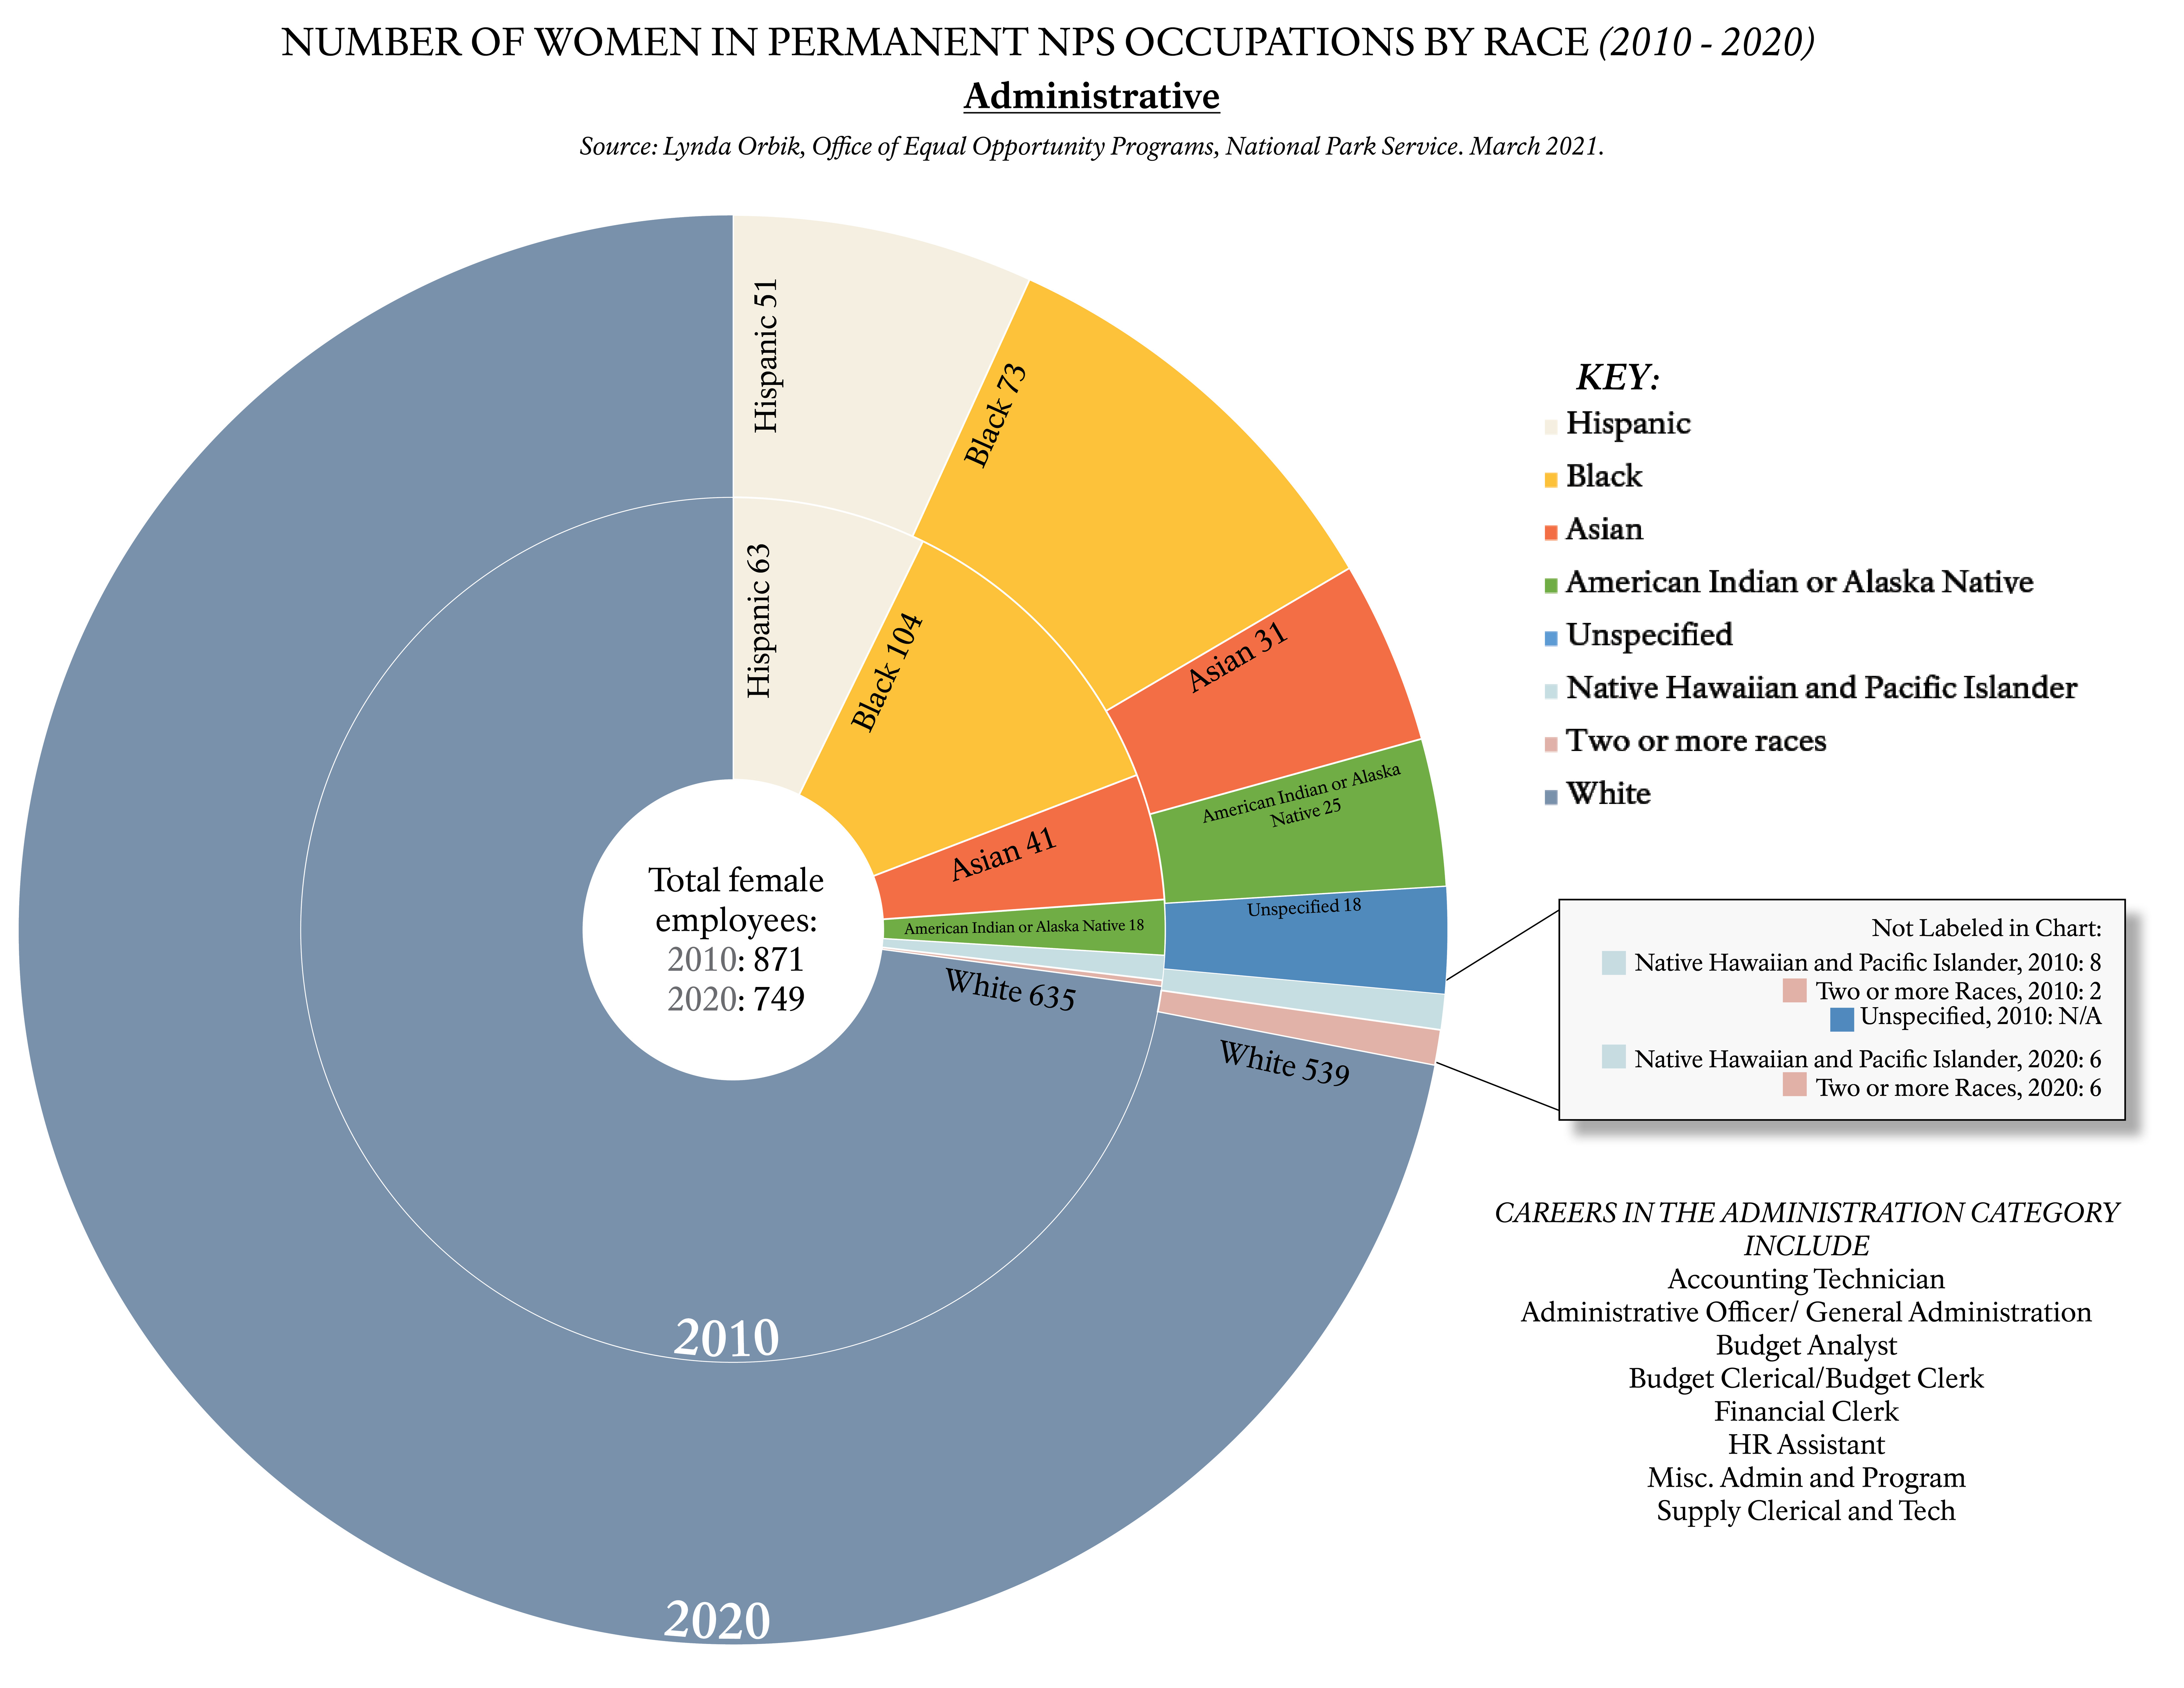
Number of Women in Permanent NPS Occupations by Race (2010-2020)
Pie chart depicting the number of women with permanent NPS positions in administrative fields, by race (2010-2020).
Pie Chart. Data is in two concentric rings of chart and compares the number of women in administrative positions in 2010 and 2020. The total number of women in these jobs decreased from 871 in 2010 to 749 in 2020 and decreases are reflected in most categories. White women make about 70 percent of the women in both years, although there was a small decrease in their numbers in 2020. Hispanics, Blacks, Asians, Native Americans or Alaska Natives, Native Hawai’ians and Pacific Islanders, and those of two or more races or unspecified are all present only in the single digits.
Permission must be secured from the individual copyright owners to reproduce any copyrighted materials contained within this website. Digital assets without any copyright restrictions are public domain.
NPS History Collection/McKenzie Hitchcock
Public domain:Full Granting Rights
Image
Harpers Ferry Center, Code: HFC
04/01/2021
01/01/0001
Public Can View
Sunday, May 2, 2021 8:37:06 PM
Sunday, May 2, 2021 8:37:06 PM
Women-Held Occupations by Race_Admin and Maint.jpg
Monday, January 1, 0001 12:00:00 AM
jpg
13.5 MB
Scenic