Select Item below to DOWNLOAD - Once item is selected, right click and choose 'save as'
73ac8ce6-f494-48fd-b826-f321b8030c5f
2019 Spectrogram Series
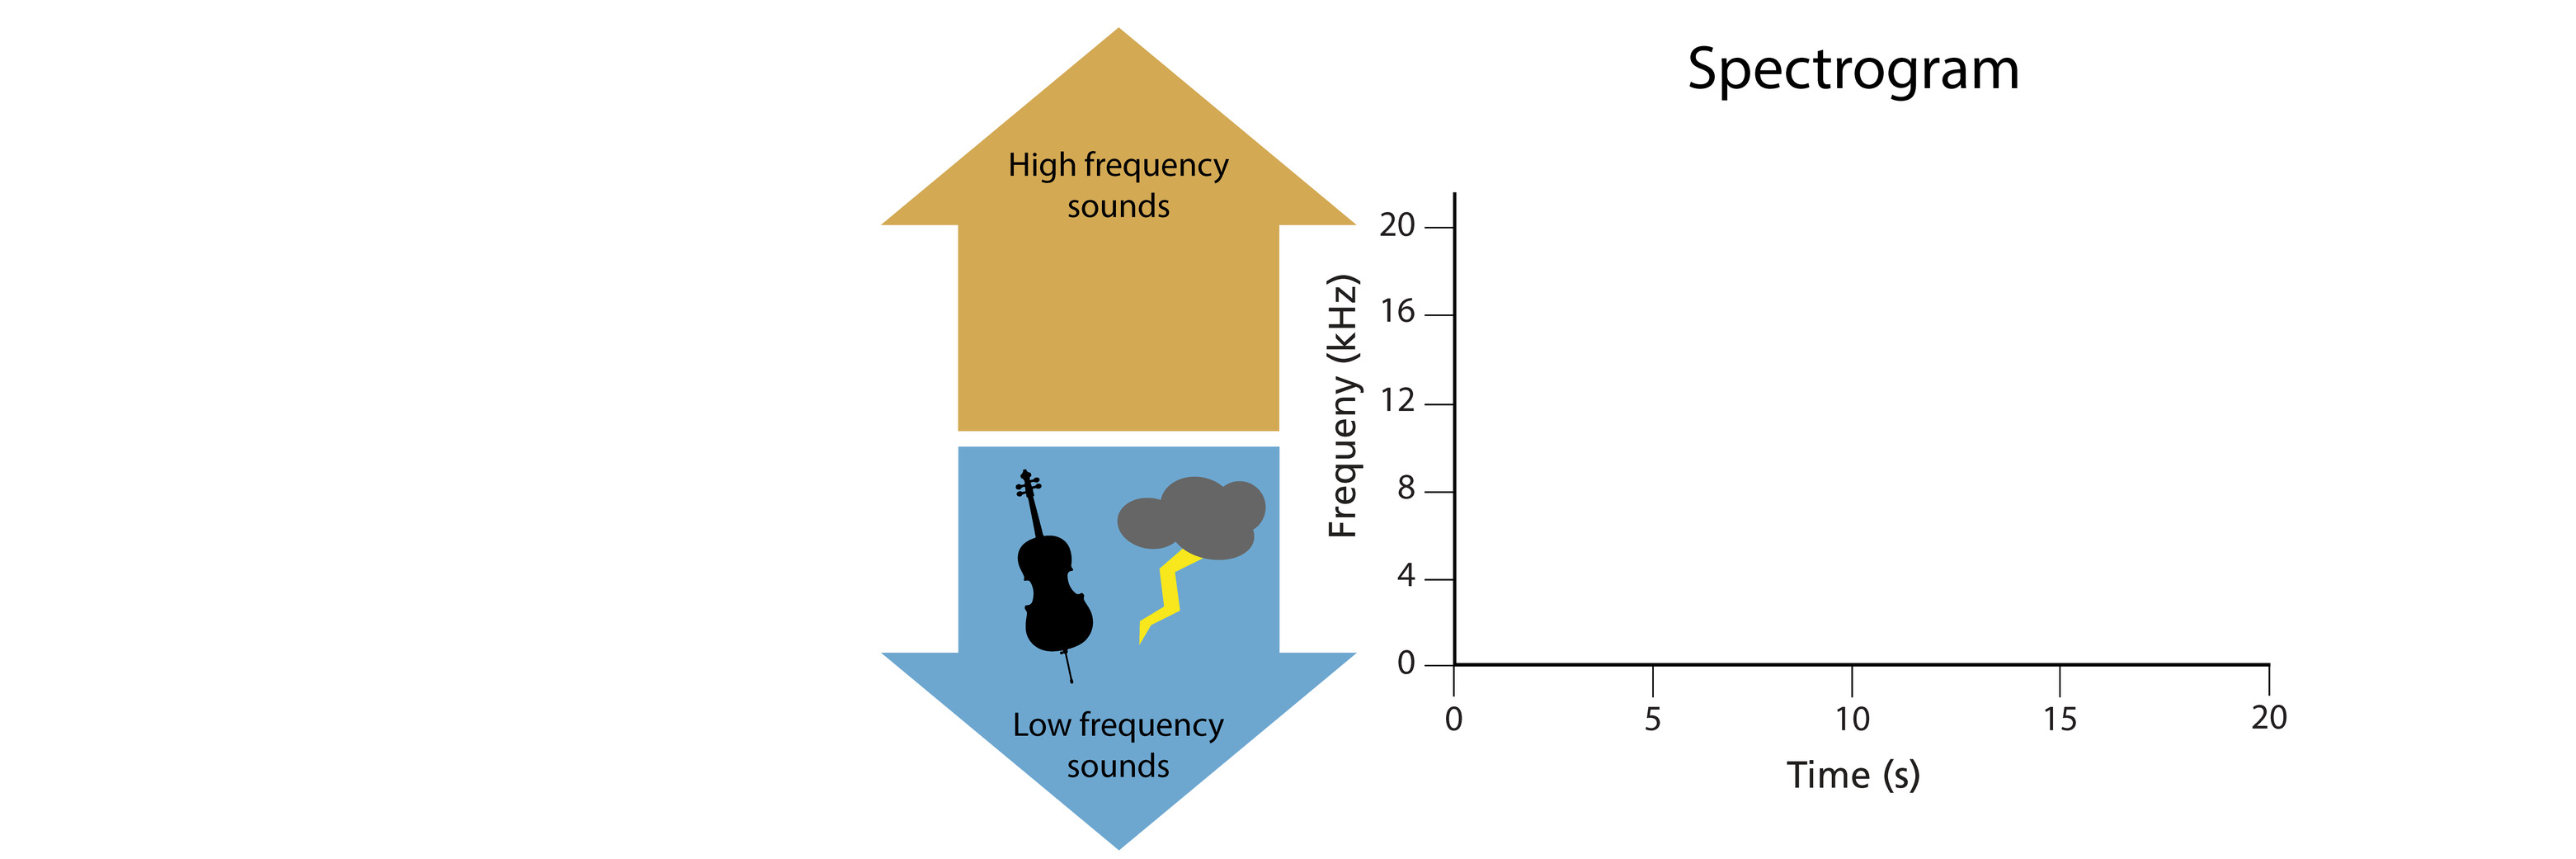
Comparison of two spectrograms that show sounds from acoustic recordings collected at 4AM and sounds at 6AM. Each spectrogram is a graph with an x and y axis. The x axis shows the time in seconds and ranges from 0 seconds to 20 seconds. The y axis shows the frequency of the sound and ranges from 0 Hertz to 20 kilohertz. Frequency is also called pitch. A cello and thunder are examples of low frequency sounds. A whistle and a siren are examples of high frequency sounds. The spectrogram on the left of the screen shows the sounds at 4AM. The only sound recorded at the time is the sound of the highway traffic. The sound occurs during the entire 20 second audio clip and is below 2 kilohertz in frequency. The spectrogram on the right of the screen shows the sounds at 6AM. In this spectrogram, highway noise is present in the entire 20 second audio clip and is below 2 kilohertz in frequency. In addition to highway noise, in the 6AM spectrogram we can see three bird calls that range in frequency from 2 to 14 kilohertz.
Comparison of two spectrograms that show sounds from acoustic recordings collected at 4AM and sounds at 6AM. The recordings were collected from Herbert Hoover National Historic Site in May-June 2019.
Permission must be secured from the individual copyright owners to reproduce any copyrighted materials contained within this website. Digital assets without any copyright restrictions are public domain.
Kathryn Nuessly, NPS
Public domain:Full Granting Rights
Image
Herbert Hoover National Historic Site, Code: HEHO
Herbert Hoover National Historic Site, Cedar County, Iowa
Latitude: 41.6674003601074, Longitude: -91.3514022827148
Latitude: 41.6674003601074, Longitude: -91.3514022827148
Public Can View
Thursday, August 20, 2020 3:03:43 PM
Thursday, August 20, 2020 3:03:43 PM
TEST_Spectrogram_Spectrogram_6.png
png
106.1 kB
Scenic