Select Item below to DOWNLOAD - Once item is selected, right click and choose 'save as'
2505964e-150e-48ec-a921-87629c17a81e
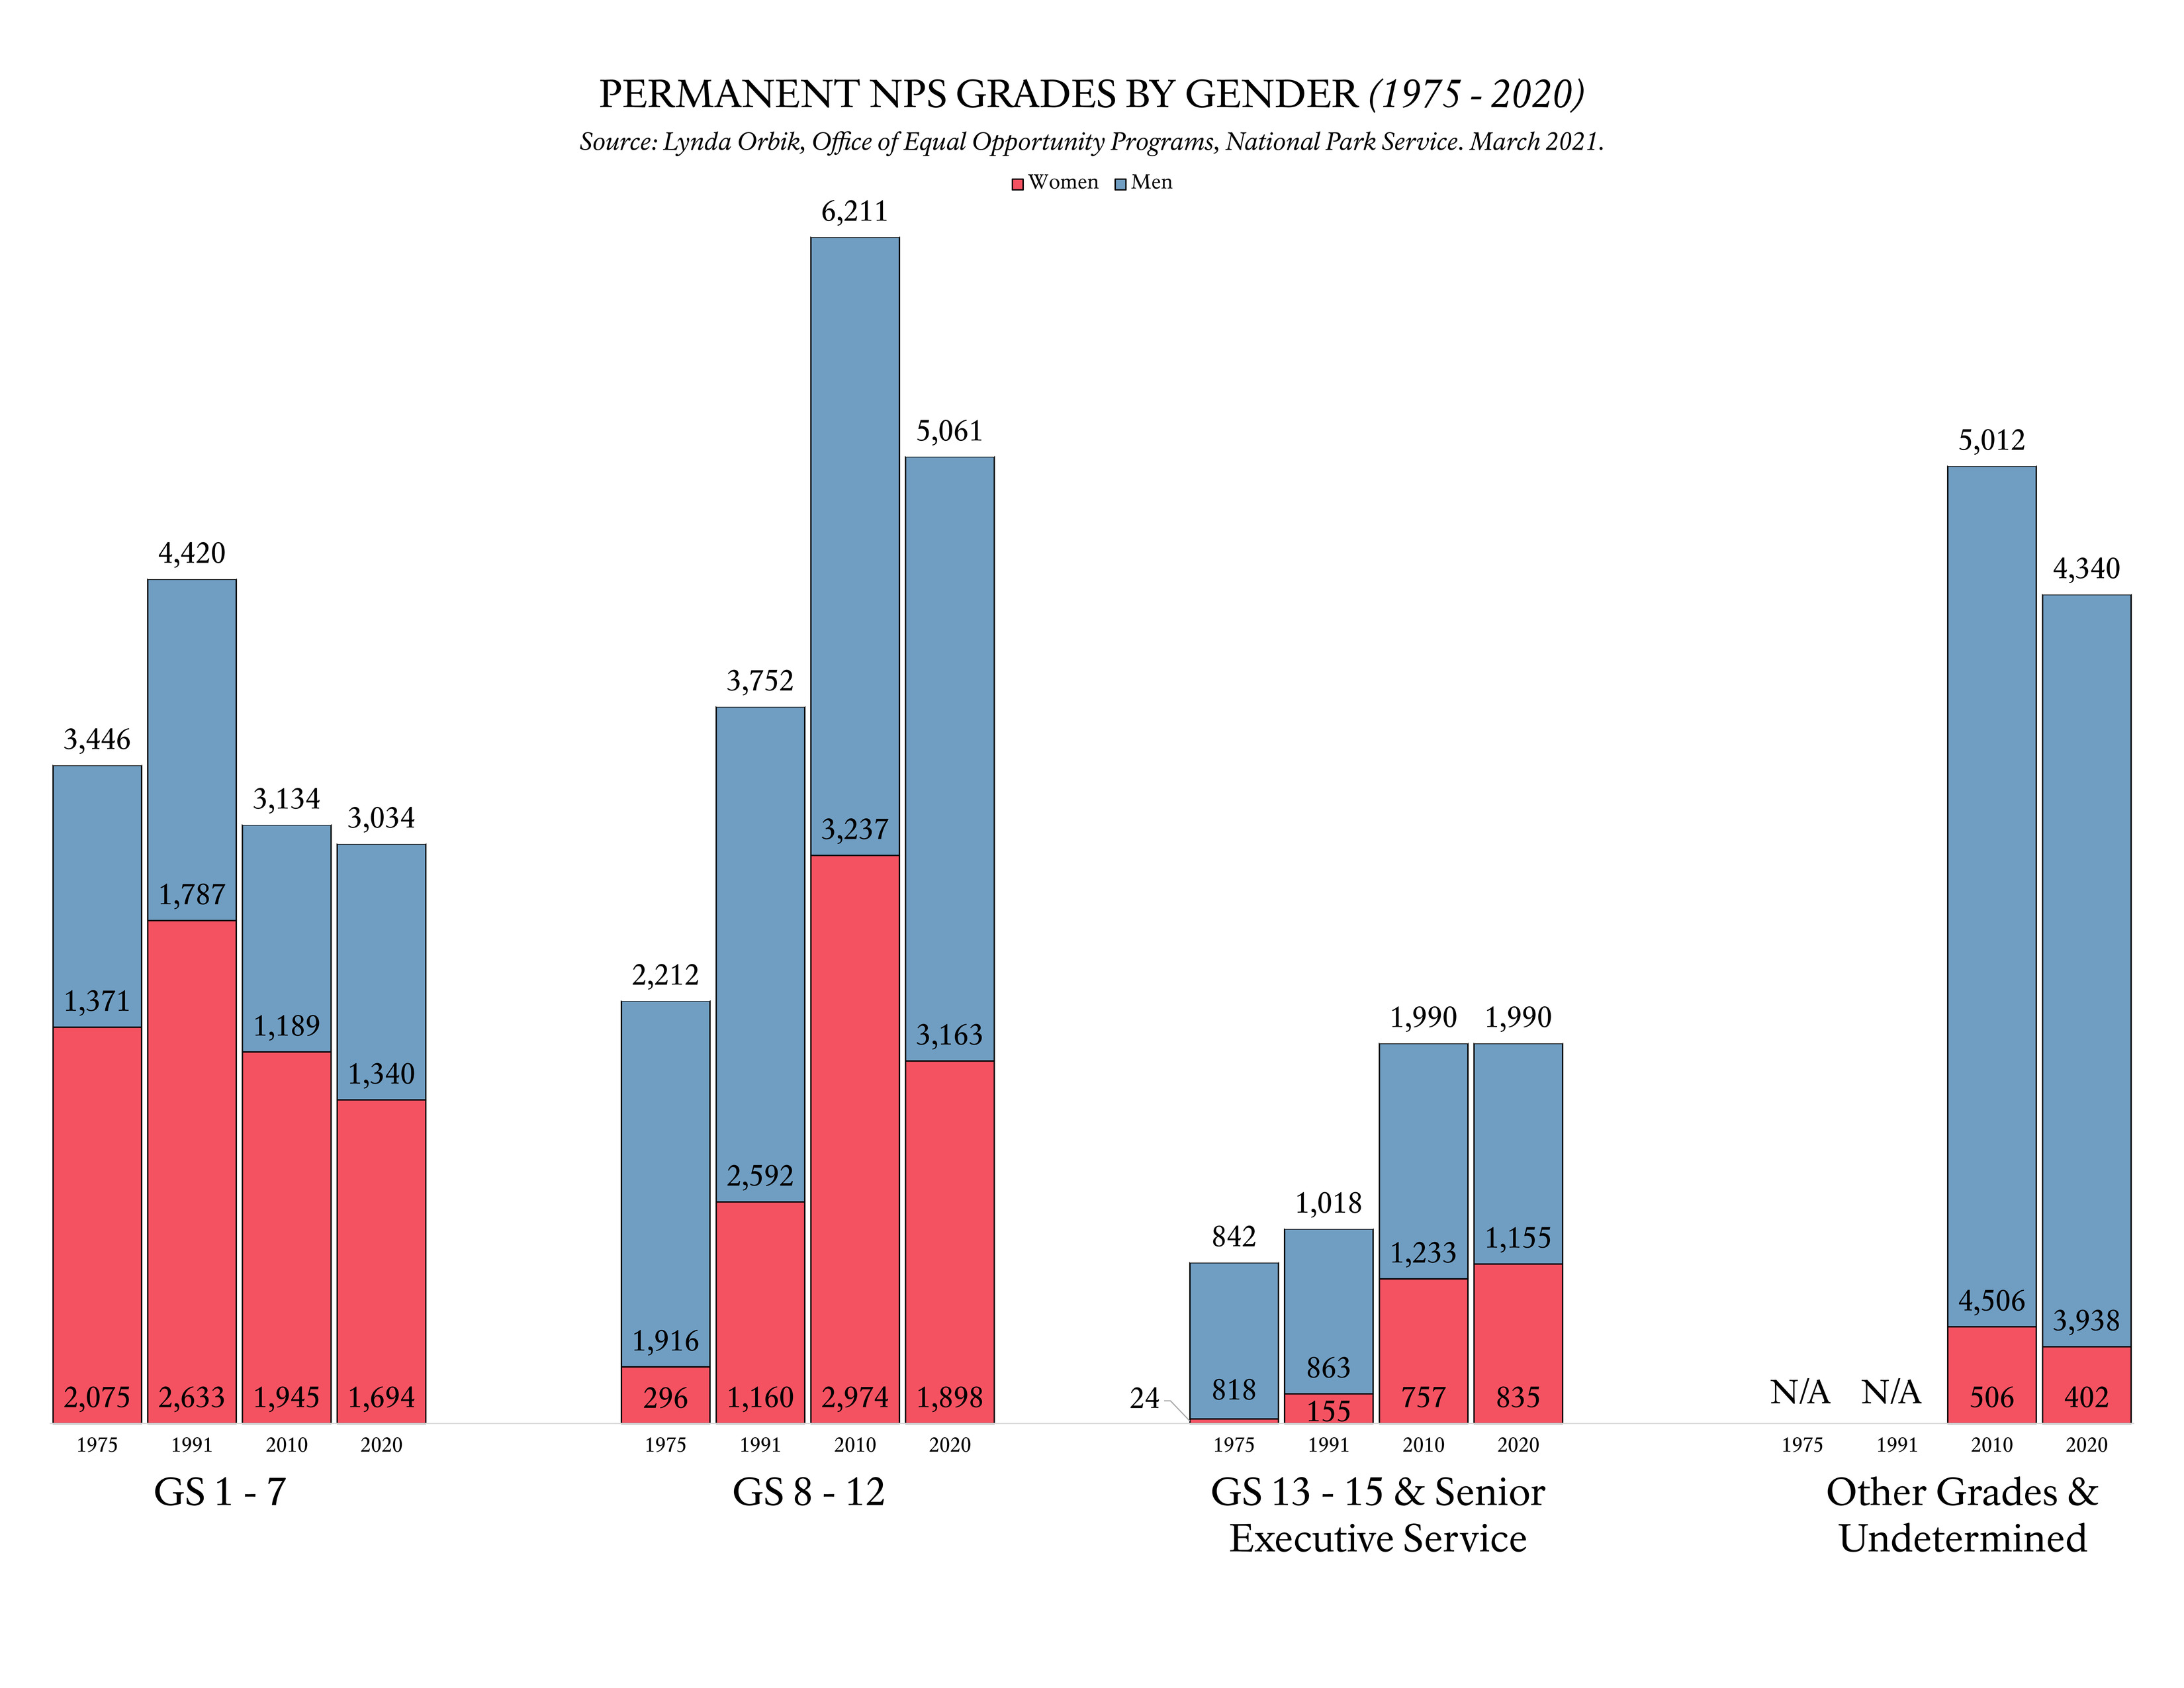
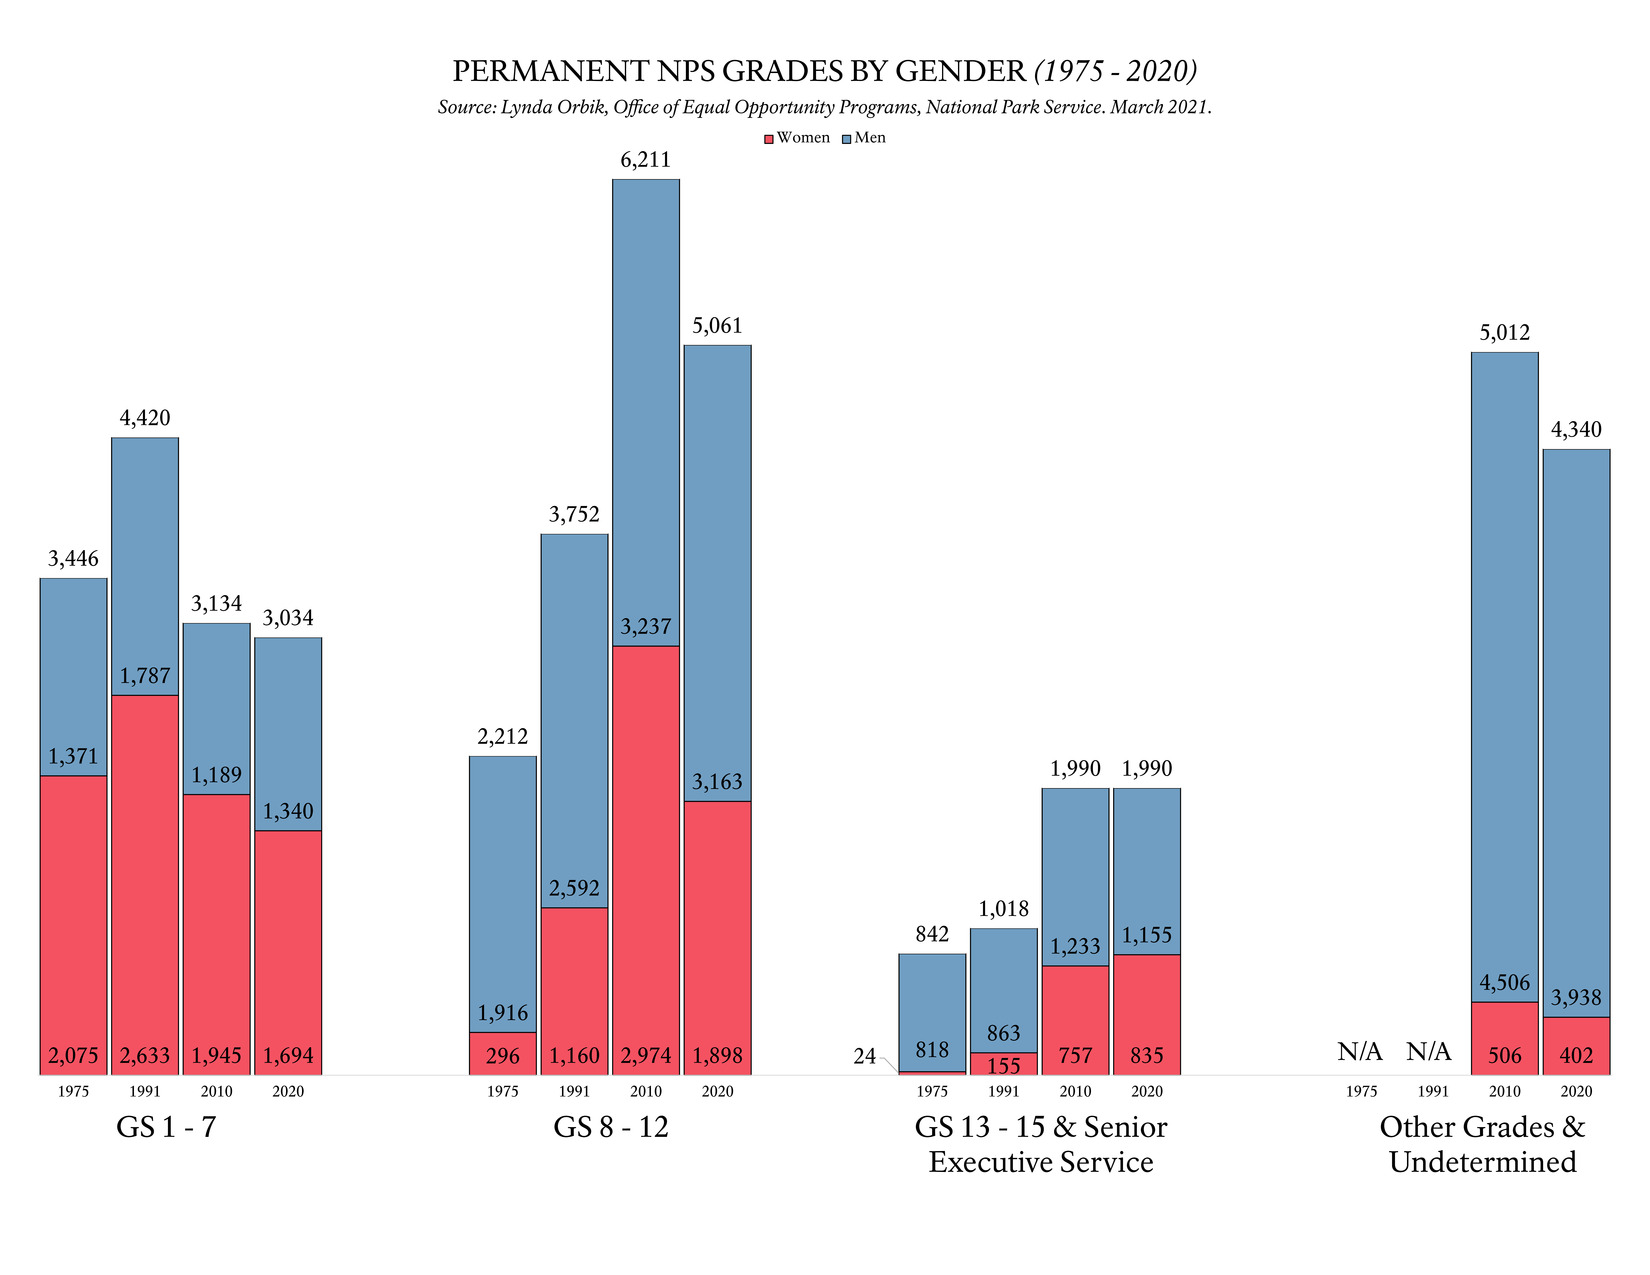
Permanent NPS Grades by Gender (1975-2020)
Bar chart representing the grade levels of jobs held by NPS men and women with permanent positions (1975-2020).
Bar Chart. Data shows pay grades by gender for years 1975, 1991, 2010, and 2020. Pay grades are grouped by series 1-7, 8-12, 12-15 and Senior Executive Service, and Other Grades and Undetermined. Women outnumber men only in grades 1-7, which are the lowest paid jobs, for all years. Although women have made gains in getting higher paid jobs since 1975, men still dominate the higher paying jobs, including those at the executive levels.
Permission must be secured from the individual copyright owners to reproduce any copyrighted materials contained within this website. Digital assets without any copyright restrictions are public domain.
NPS History Collection/McKenzie Hitchcock
Public domain:Full Granting Rights
Image
Harpers Ferry Center, Code: HFC
04/01/2021
01/01/0001
Public Can View
Sunday, May 2, 2021 8:38:21 PM
Sunday, May 2, 2021 8:38:21 PM
Grades by Gender.jpg
Monday, January 1, 0001 12:00:00 AM
jpg
11.8 MB
Scenic