Select Item below to DOWNLOAD - Once item is selected, right click and choose 'save as'
0514ec3d-afd1-4049-ba27-fa1255b8acc6
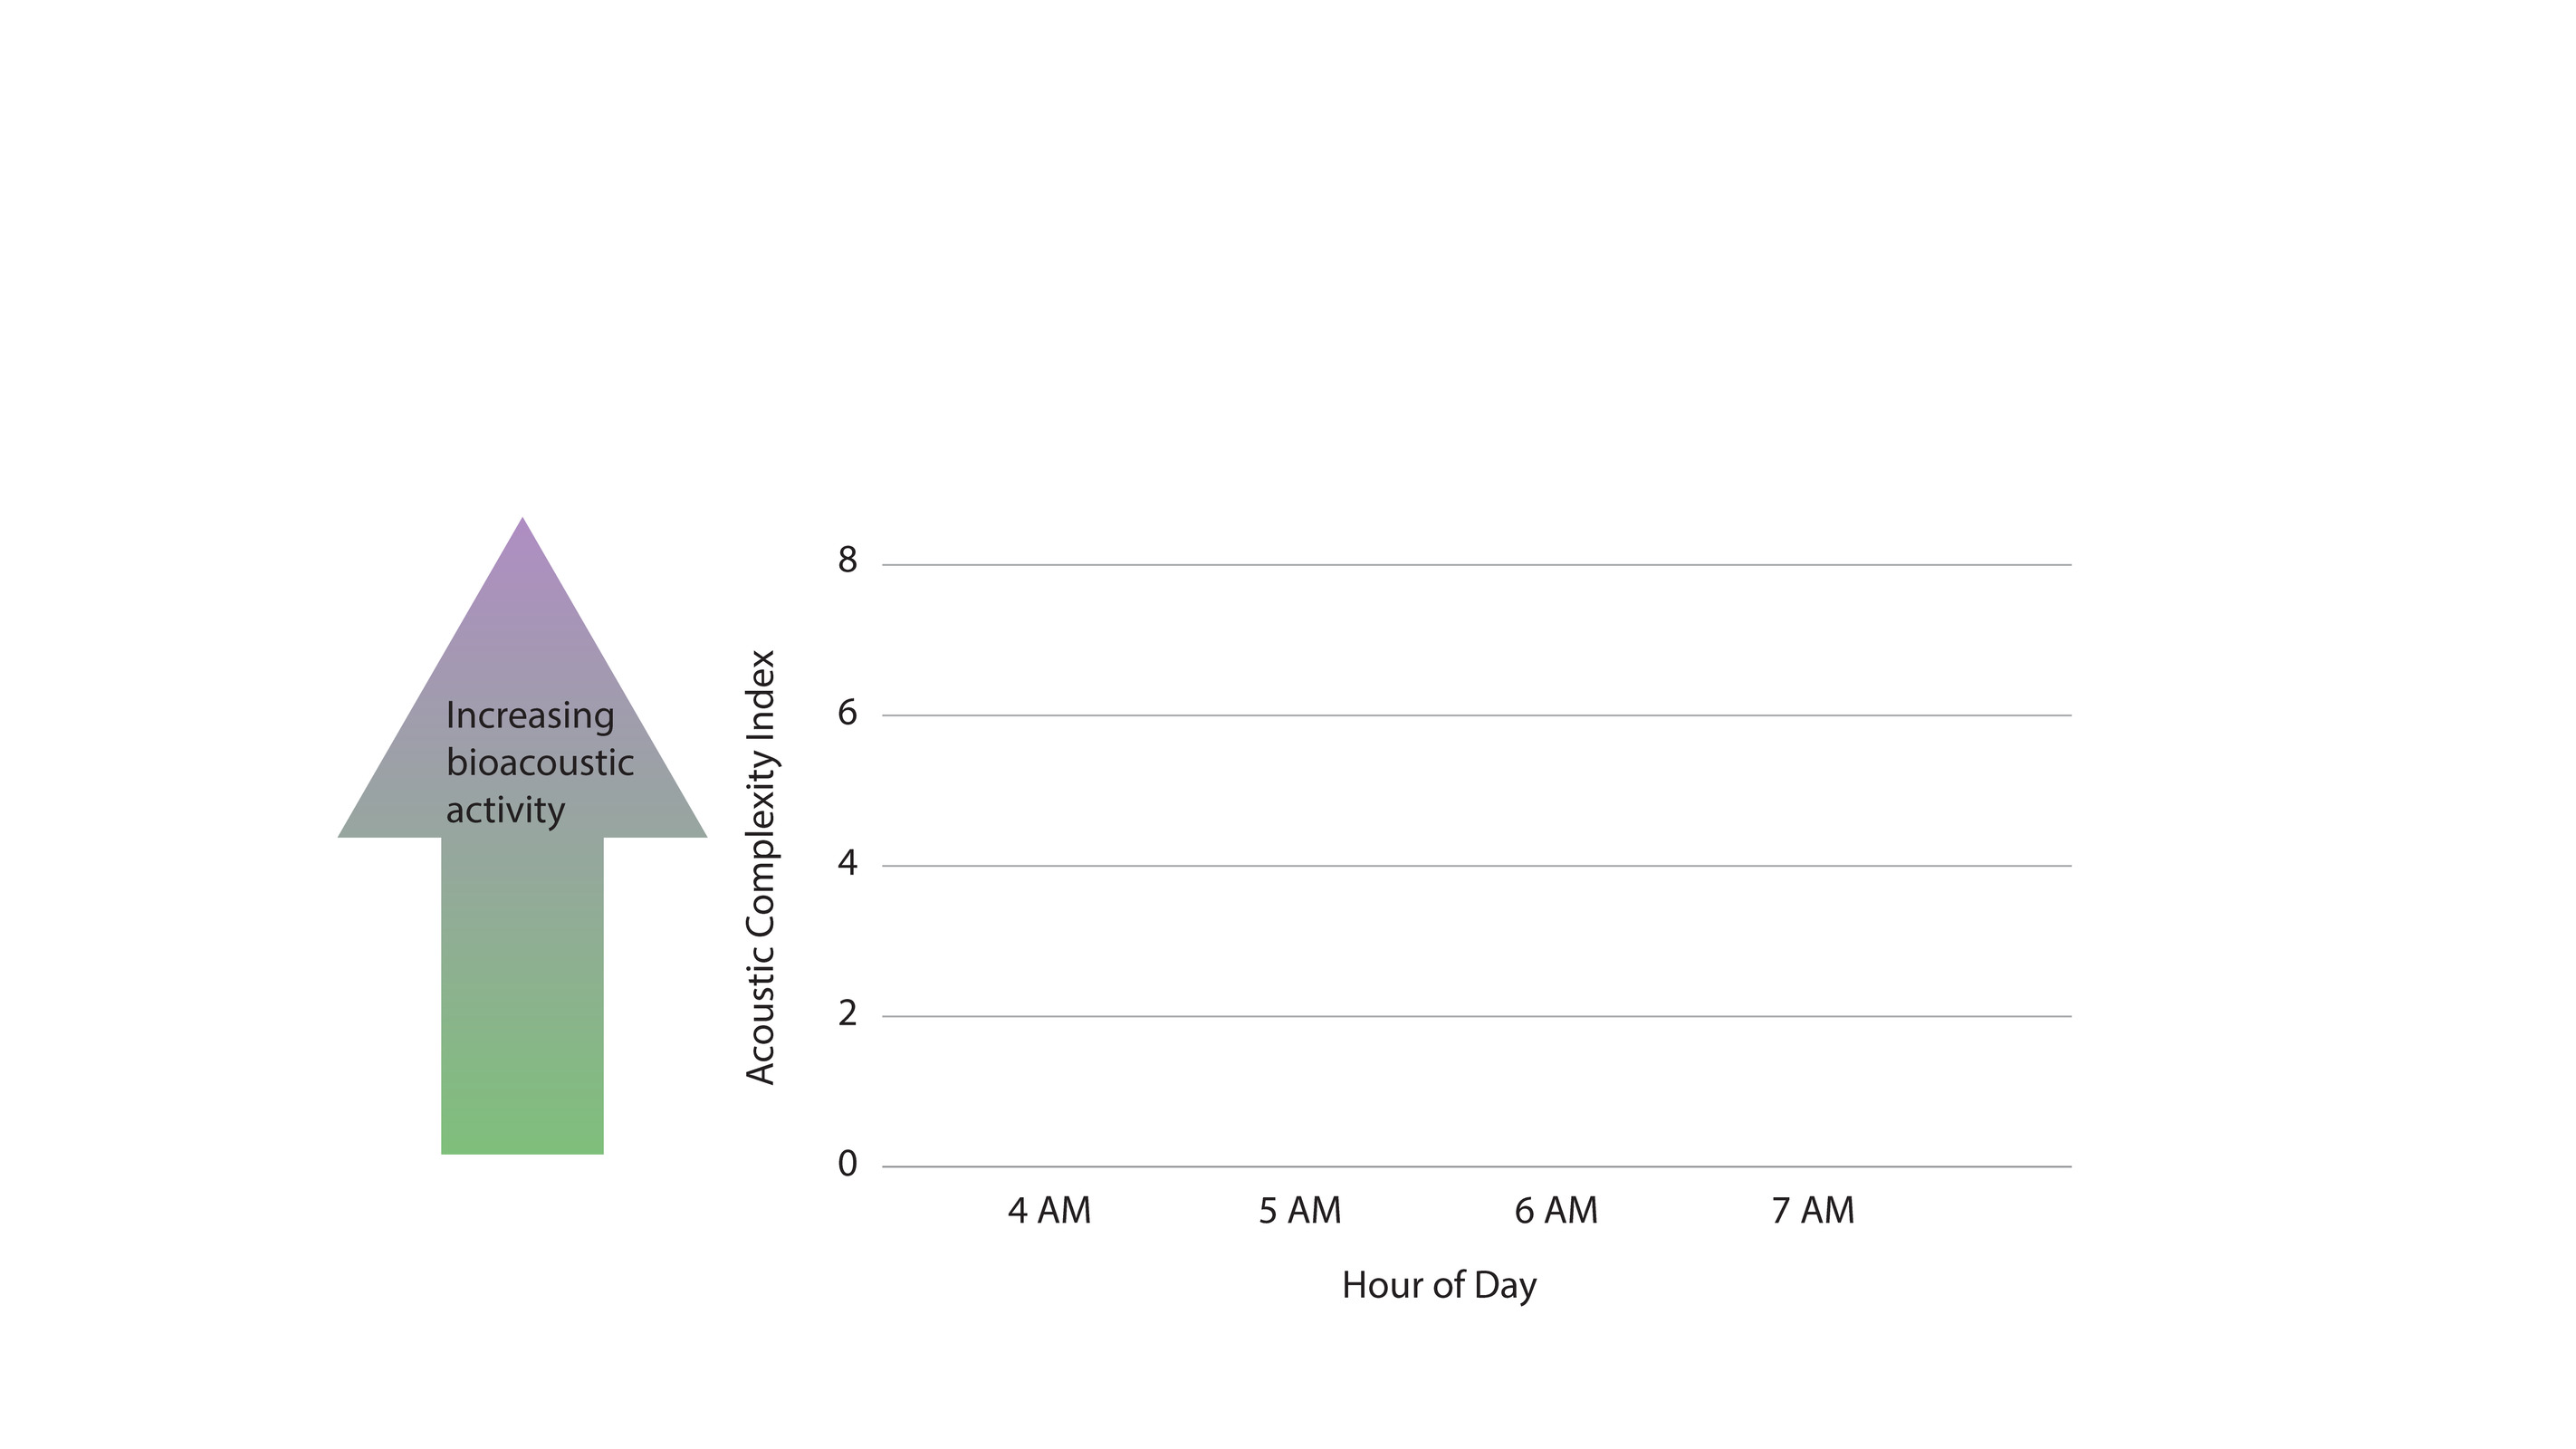
2019 Acoustic Complexity Index Graph Series
The acoustic complexity graph has an x and a y axis. The x axis shows the hour of day and contains four hours of data including 4AM, 5AM, 6AM, and 7AM. The y axis shows the acoustic complexity index, a measure of bioacoustic activity. This particular graph shows an acoustic complexity index of 3.7 at 4AM, 7.8 at 5AM, 7.4 at 6AM, and 7.1 at 7AM. A text box on the graph asks the question: why is there less bioacoustic activity at 4AM?
Graph of acoustic complexity index calculated from acoustic recordings collected from Herbert Hoover National Historic Site in May-June 2019.
Permission must be secured from the individual copyright owners to reproduce any copyrighted materials contained within this website. Digital assets without any copyright restrictions are public domain.
Kathryn Nuessly, NPS
Public domain:Full Granting Rights
Image
Herbert Hoover National Historic Site, Code: HEHO
Herbert Hoover National Historic Site, Cedar County, Iowa
Latitude: 41.6674003601074, Longitude: -91.3514022827148
Latitude: 41.6674003601074, Longitude: -91.3514022827148
07/17/2020
Public Can View
Friday, July 24, 2020 1:58:55 PM
Friday, July 24, 2020 1:58:55 PM
ACI_Graph6.png
png
105.4 kB
Scenic